
STATTS (Scorekeeping iOS App)
Design Research | UX/UI
Tools: IDEO Design Thinking, Figma, Adobe Illustrator, iOS Design Guidelines
Overview
Many people have had a part-time job that they thought they could make more efficient. Companies are looking for ways to do more with fewer people, and the way they are accomplishing that task is by working smarter, not harder. My job is to create an app that makes my job more efficient.
Problem
Scorekeepers need an efficient way to perform their job tasks because their job performance is crucial to the game at play. Without them, the game would not be organized and the score would not be tracked correctly.
Goal
My scorekeeping app will let users perform their jobs efficiently, which will affect basketball leagues by improving its internal structure. I can measure effectiveness by comparing the time it takes for scorekeepers to tally scores and stats and prepare for their next game.
Job Description: FCYBA Scorekeeper
Job Tasks: Keep track of the score and stats during an assigned basketball game. Assist in collecting scoresheets from other scorekeepers so final scores and player stats can be uploaded to the official website.
Background: Fayette County Youth Basketball Association is a non-profit association dedicated to providing Fayette and surrounding counties a fun learning and playing environment for youth basketball. They compete using Georgia High School rules to prepare athletes in moving forward in their school programs.

What Challenges Do I Face?
Since 2015, I have witness firsthand how the league has experienced minor hiccups throughout its development. Throughout my time, I have identified 3 painpoints that consistently resurface each season. Some of these painpoints have tried to be resolved, but their methods did not provide longterm success. By tackling these key issues, they would help to eliminate smaller concerns that stem off these painpoints.

Pre-Game: Waiting for ScoresheetsMost coaches spend their time with their team preparing for the game. Several times coaches have waited to turn their sheets in mere minutes before the game starts. Coaches not turning in their scoresheets during pre-game warm ups prevents me from making sure everything I need is is order, and may possibly delay the start of the game.

In-Game: Constantly Double Checking TotalsBecause the scorebook acts as the official score, I have to make sure the totals add up (so there are no mistakes later). Taking time to count someones personal points can take attention away from the game. There is a short amount of time between quarters to review the score, and most coaches approach the table to ask about players stats at this time.

Post-Game: Reviewing Score Before the Next GameOn average, there is less than 5 minutes before games. Not only do I have to make sure both scoresheets are accurate, I have to make sure that I have the scoresheets for the next game and that they are filled out correctly. This tends to be the most chaotic time as it feels like I have to do 10 things at once in a short time period.
How Do Other Scorekeepers Feel?
By interviewing scorekeepers of various leagues, I learned that although each league has differing procedures, similar painpoints were experienced by everyone. Mapping all the differing perspectives played a major role in making sure my app is able to accomplish my goal: Establish Efficiency.
Avatar provided by Pablo Stanley via blush.design
What is the Process Like Now?
While interviewing the different scorekeepers, I asked them to map out what their task list includes. This allowed me to make direct connections between leagues and see which tasks are similar between keepers. After seeing the individual flows side-by-side, I noticed how the general flow is Collecting (pre-game), Tallying (in-game), and Reporting (post-game).
Scorebook Example
Below is an example of what a basketball scorebook would look like after a game. Each league uses this format, but may omit some sections if necessary. I know it may look intimidating at first glance, but after some practice, keeping stats is as easy as pie!
If you would like to learn more about each section and how it works, here is a link to a Basketball Scorekeeping Walkthrough.
Example provided in the Cramer Scorebook (Mark V Basketball)
Ideating + Collaborating
I noticed patterns in my research that pointed me in the direction of focusing on reducing time spent on key tasks and improving efficiency between games. To further explore these patterns, I generated statements that pinpointed specific areas that reduced efficiency. After collaborating with other scorekeepers, the top 5 statements to picked to serve as the driving force of my app.

Paper vector created by macrovector - www.freepik.com
Preliminary Sketches
I wanted the main User Flow to mimic what scorekeepers are used to doing before, during, and after a game. By adopting a similar work structure, the transition from physical scoring to digital scoring with be smooth and easy to follow. The sketches helped me eliminate repetitive tasks and explore ways for keepers to gather the information they need.
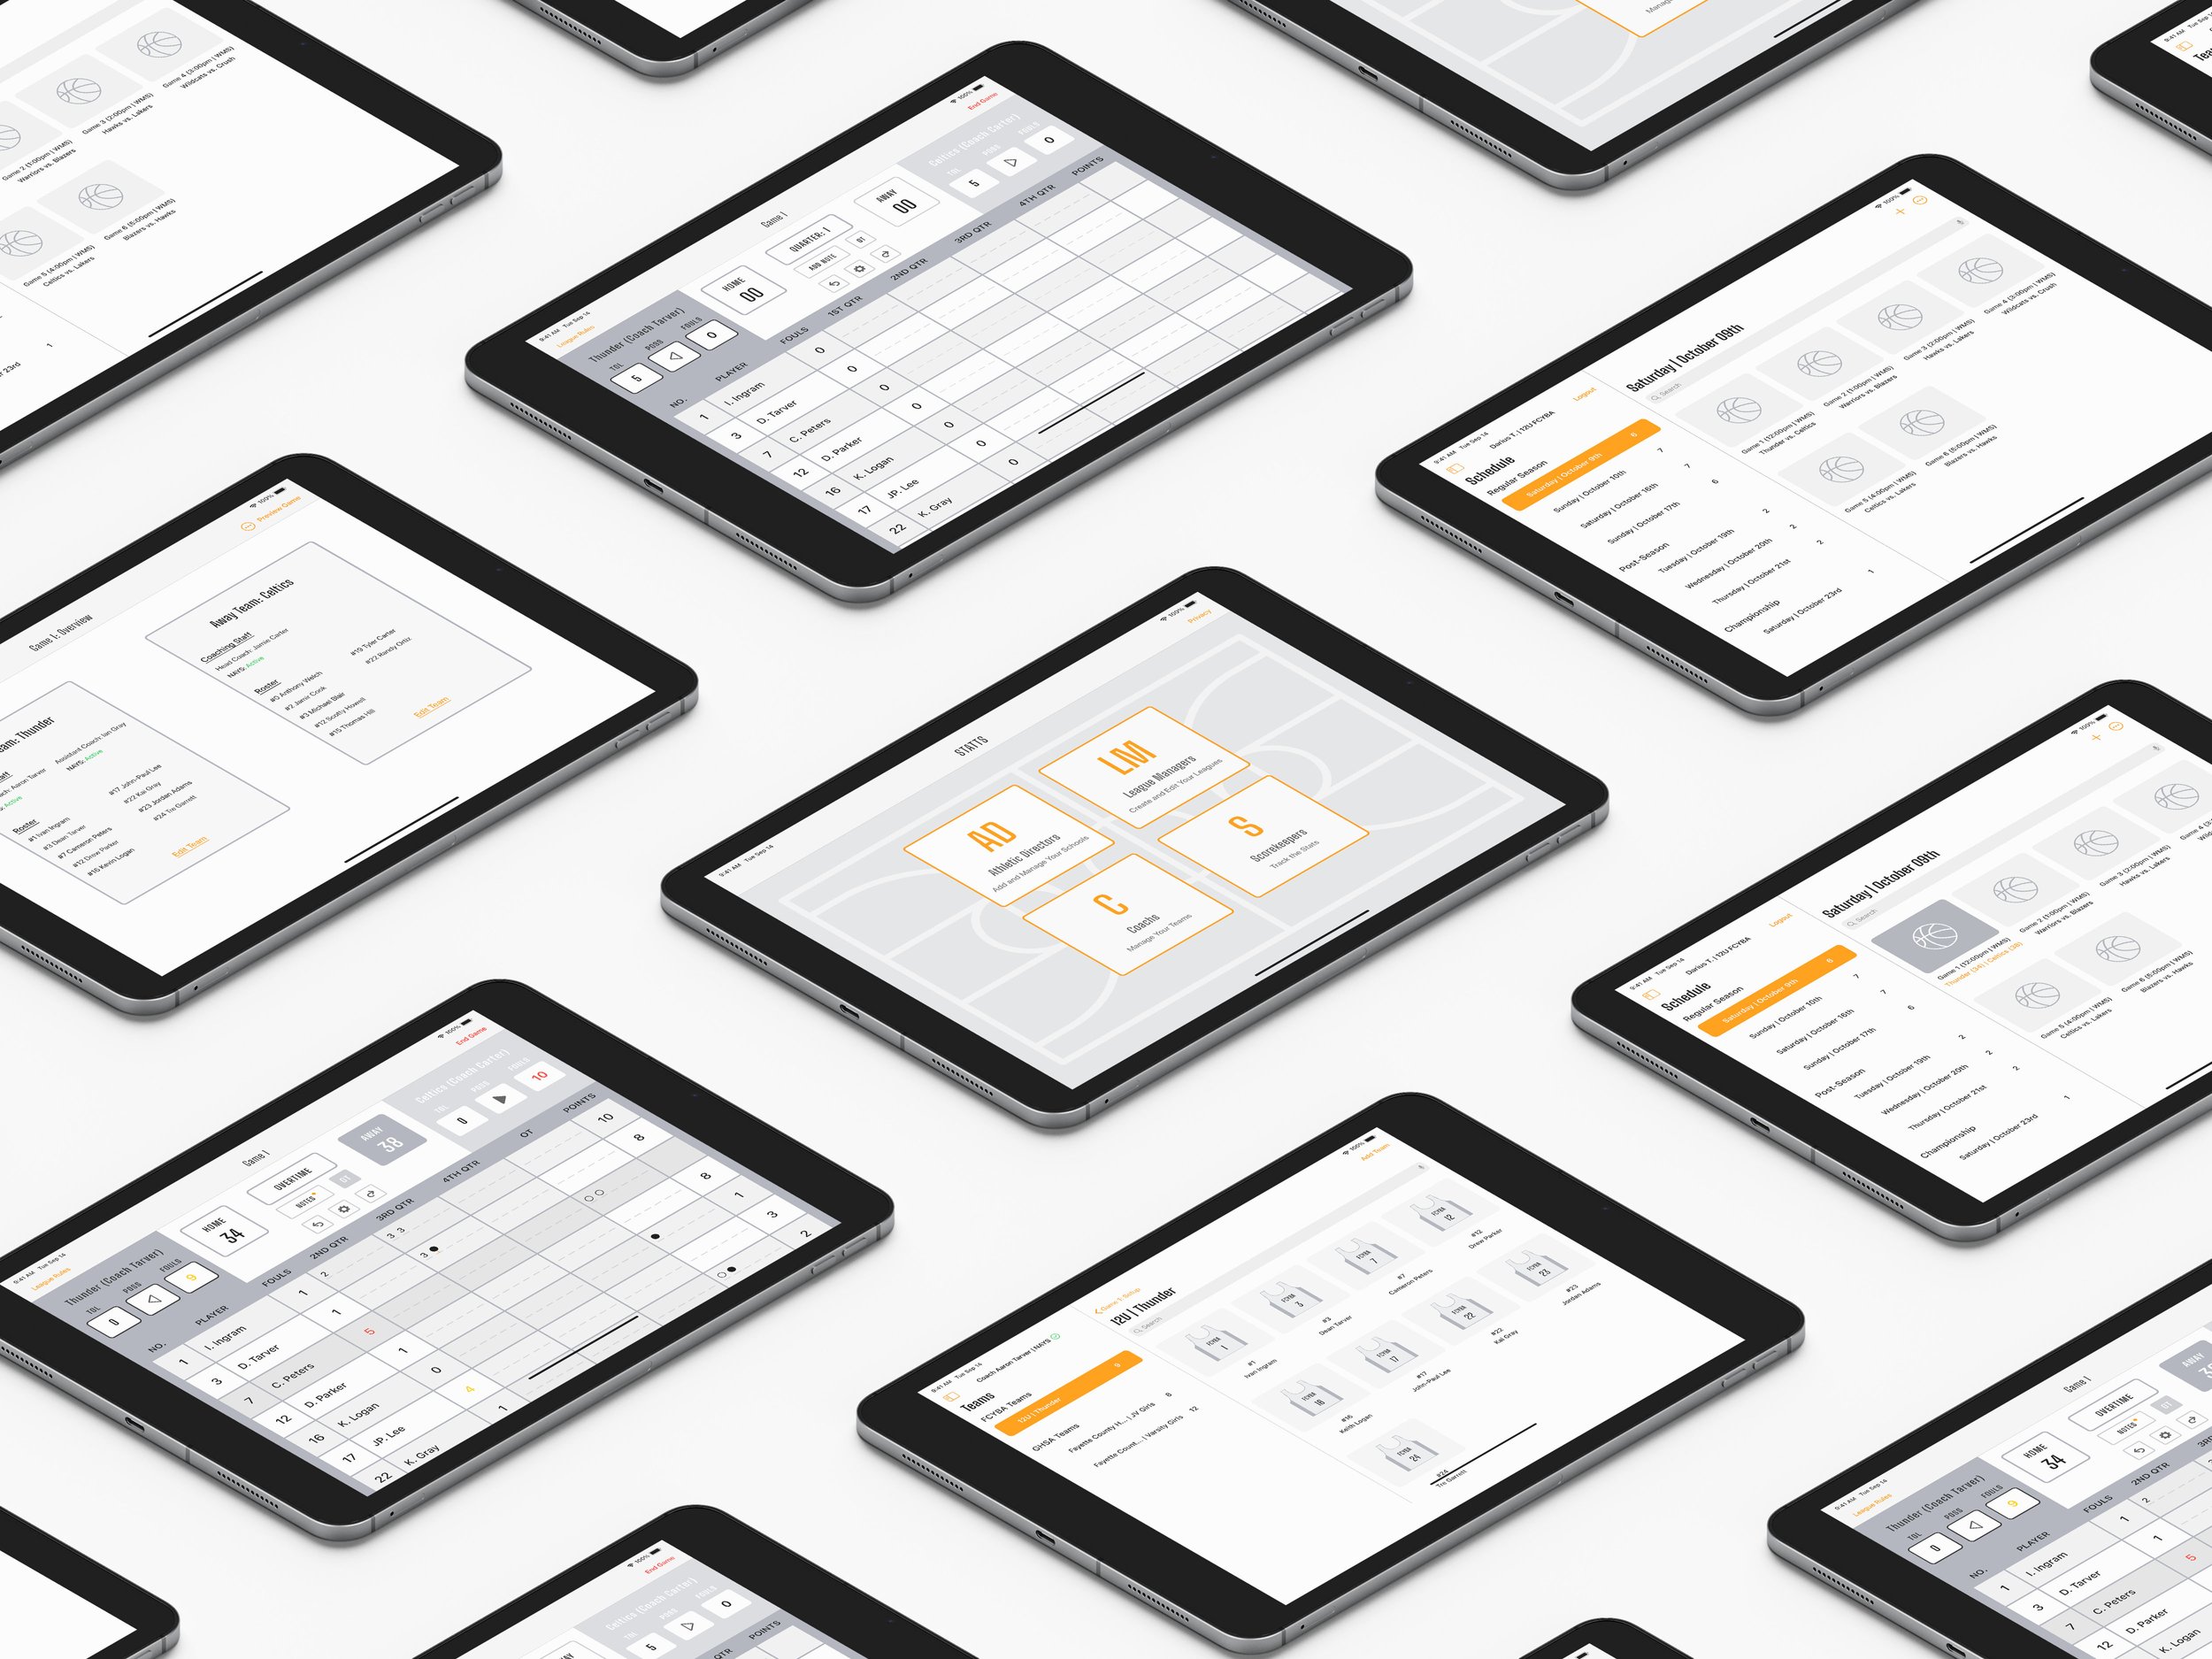
See It All Come Together
Join me as I walkthrough the app and highlight the benefits of the interface. We will be following through the perspective of Darius. If you would like to view the prototypes, click the title below each video to explore or follow along!
System Usability Scale Report
After designing the app screens, I followed up with a System Usability Scale test to see how some of the scorekeepers felt about the app’s usability. I modified some of the questions to get specific feedback about key moments in the user flow. Participants were asked to complete the exit questionnaire following an unmoderated run-through of the app to avoid Social Desirability Bias.
After receiving all the responses, I calculated each SUS score and and compared them to the standard average SUS score of 68. My average SUS score was a 77, which is above average and indicates that my app is on the right track!

View the full list of SUS Questions in my Process Deck!
Did My App Increase Efficiency?
Returning to the purpose of the app, I needed to see how my app compares to the traditional methods of scorekeeping. To see if the app allows users perform their jobs efficiently, I wanted to compare the time it takes for scorekeepers to tally scores and stats while preparing for their next game. I was able to record my pre- and post-game times while working a weekend with FCYBA. To compare times with using the app, I created a mock test that replicated the same steps by watching a similar game.
After taking the average time during 1 weekend of scorekeeping, I found that the app reduced my time during both pre- and post-game checks. I was able to reduce the amount of time it takes to make sure each player state line and teams totals add up. Reducing post-game review time played a major role in reducing pre-game prep time. A continuous cycle!

View a full league-by-league breakdown in my Process Deck!
Project Takeaways
Impact Outside of BasketballI noted how this app reduces the amount of paper waste associated with scorebooks and scoresheets. In just 1 weekend of FCYBA games, an average of 62 scoresheets (2 per game) are used. With the app, there would be no paper waste as everything is tracked digitally (scorekeeper and coach ID badges could be printed on eco-friendly materials or kept as a QR code associated with their account).
With More Time and ResourcesWith more time I would love to explore more ways to customize the scoresheet interface to accommodate different leagues. Not only would this allow more leagues to adopt this app as the main methods of scorekeeping, but it will show the flexibility of the app to adapt to the needs of a diverse group of users.